Alfred
Shingai
I’m a data analyst with a strong foundation in Python, Power BI, and Excel,
focused on turning raw data into actionable insights that support better decision-making.
I enjoy working with data to uncover patterns, solve problems,
and present findings in a clear and meaningful way.
I work across the
analytics process—cleaning and transforming data using Python (Pandas, NumPy),
and building interactive dashboards in Power BI using DAX, Power Query,
and data modeling techniques. In Excel,
I create structured reports and dashboards using Pivot Tables, XLOOKUP,
and advanced formulas to communicate insights effectively.
I focus on asking the right questions, simplifying complex data, and delivering insights
that are practical and easy to understand. My goal is to produce work that is not only accurate,
but genuinely useful in real-world decision-making.
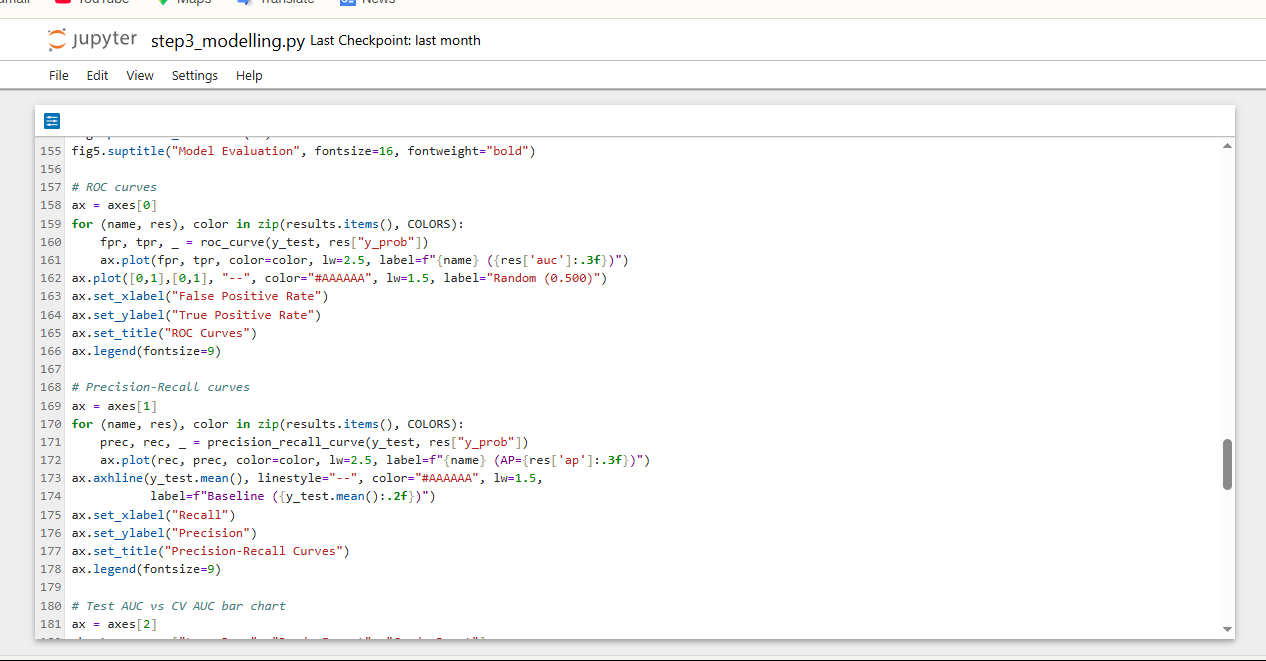
 Python
 Pandas
 NumPy
NumPy Jupyter Notebook
 Power BI
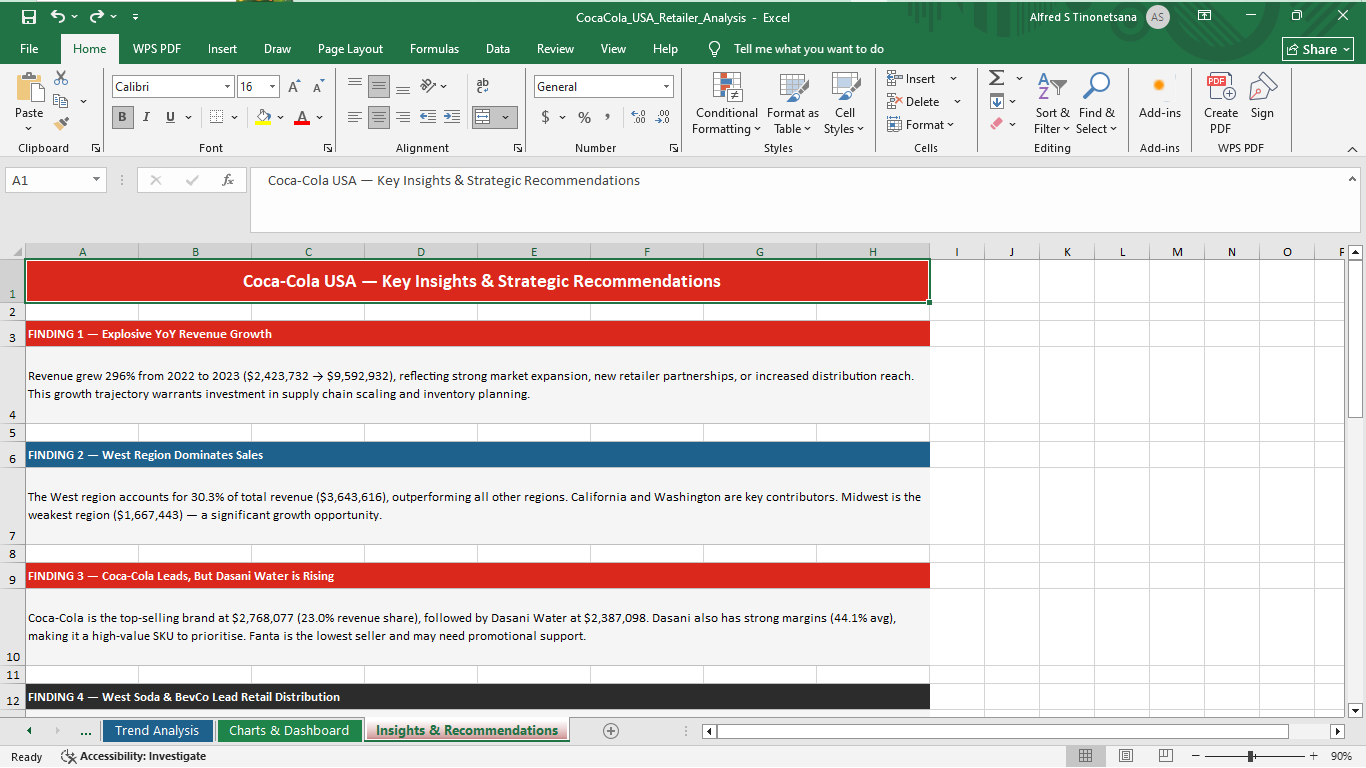
 Excel
Excel